Why We Should Buy Low and Sell High (And Some Quick Tips on Doing It)

Whether you’re an experienced professional trader or a complete beginner in the markets, you’ve likely heard the popular saying “buy low, sell high”.
While this sounds like a very easy way to make money in the markets, it can be difficult to implement in real-life trading. The main problem for traders is to identify how low is low enough to buy, and how high is high enough to sell.
Here, we’ll explain what “buy low, sell high” is really about and give you some quick tips and tricks on how to do it.
- Learn more, take our premium course: Trading for Beginners
What Does “Buy Low, Sell High” Mean?
The saying “buy low, sell high” refers to the nature of market cycles.
When markets are trending, they don’t move up or down in a straight line. Instead, markets are occasionally forming price-corrections that move in the opposite direction of the established trend.
Traders aim to catch the low of a price-correction during an uptrend to buy the underlying asset at a lower, discounted price, hoping the price will continue to move to the upside. During downtrends, markets form higher highs and higher lows on their way up. Higher highs exceed the previous high formed by the price, while higher lows represent counter-trend moves of a shorter duration.
Those highs and lows form because of a number of reasons, including profit-taking activities, portfolio rebalancing activities, and herd following, to name a few.
Conversely, traders who are trading during a downtrend try to catch the top of a price-correction in order to short-sell a financial instrument at a higher price, providing them with a higher profit potential if the market continues to move in a downtrend. During downtrends, the market forms lower lows and lower highs, with each consecutive lower low exceeding the previous low. Lower high, on the other hand, is a counter-trend move that goes in the opposite direction.
Tip: The top of a lower high would be an excellent point to short-sell the market.

However, while this sounds like an easy trading strategy to make consistent profits in the market, many traders have difficulties to measure how low is low enough to buy, and how high is high enough to sell.
There are many tools, primarily technicals, that aim to answer that question. In the following lines, we’ll cover how Fibonacci tools and Moving Averages can be used to time your entry in the market, and how you can take advantage of market sentiment indicators to identify the top or bottom of price corrections.
- Learn more, take our popular: Trading for Beginners Course
Tip 1: Moving Averages Can Reflect the Overall Market Trend
Moving averages are a popular technical tool that uses past prices in its calculation. In essence, a moving average plots the average closing price of the last n-periods, where the variable n is a pre-specified number.
Besides SMAs, traders are also using the EMA (exponential moving average), where recent price-data gets relatively higher importance in the formula than older prices.
Moving averages are frequently used by traders who want to buy low and sell high in the market. The 100-day or 200-day MAs are a popular tool to identify the overall market trend – when the MAs point up, the market is in an uptrend, and when the MAs point down, the market is in a downtrend.
- Learn more, take our free course: Moving Averages Explained
Traders should look to buy at dips during an uptrend (buy low) and sell at peaks during a downtrend (sell high.) Those MAs can also act as dynamic support and resistance levels at which the price tends to bounce off.
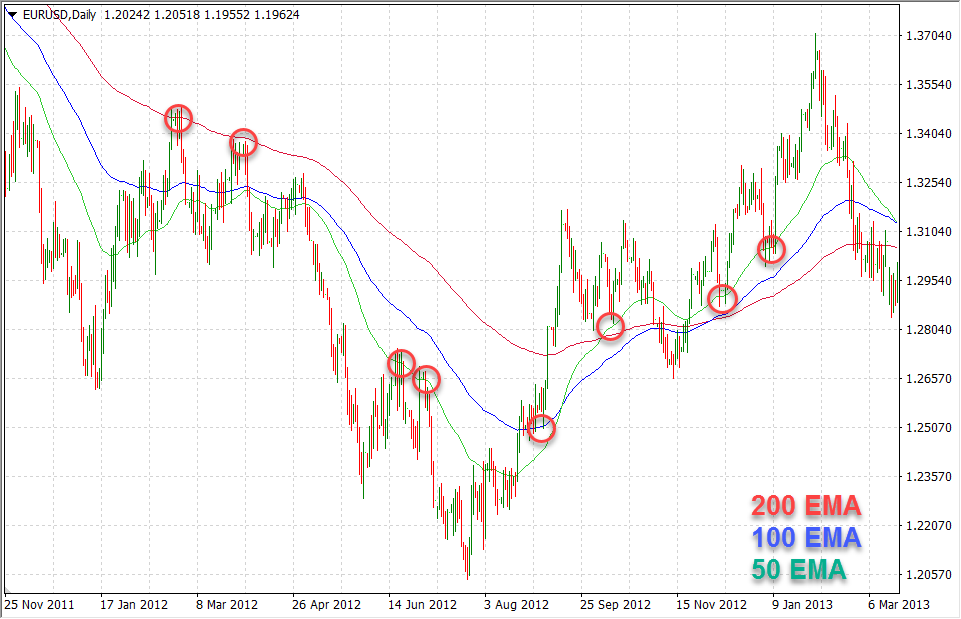
By adding the 50-day MA to the 100-day or 200-day MAs, traders could buy when the 50-day MA crosses below the 200-day MA during an uptrend. This signals that the market is forming a low while prices are still in a general uptrend. Similarly, by selling when the 50-day MA crosses above the 200-day MA while the market is in a downtrend, traders could be able to catch the top of a price-correction during downtrends.
Still, this doesn’t tell us the exact level at which to buy or sell, which brings us to the next tool – Fibonacci levels.
Read: 21 Day Trading Blogs That Will Blow Your Socks Off
Tip 2: Use Fibonacci Tools to Time Your Entry
Fibonacci tools are based on the Fibonacci sequence of numbers, named by the famous mathematician Leonardo Fibonacci.
He discovered a simple series of numbers that can be found in many places in nature which goes like this: 1, 1, 2, 3, 5, 8, 13, 21, 34… By dividing each number with its succeeding number, we always get the same result of 0.618, also called the Golden ratio.
Interestingly, the Golden ratio can also be found in the markets. Traders around the world are watching price-levels that align with Fibonacci ratios and place their orders near those levels, making them a self-fulfilling prophecy. The two most important Fibonacci ratios include 0.382 and 0.618.
The following chart shows the EUR/USD pair finding support at the 61.8% Fib level during a fresh uptrend. The pinbar at the Fib level offered an excellent buying opportunity.

By plotting a Fibonacci retracement tool from the recent trough to the recent peak (the impulse move), we’ll get a number of levels where a market correction could find support or resistance and reverse in the direction of the underlying trend.
Since Charles Dow also discovered that the market has a tendency to form corrections that reach 50% of the underlying impulse move, we say that the area between the 0.382 and 0.618 Fibonacci levels (i.e. 38.2% and 61.8%) are levels where the correction could end and reverse, providing us with a trading opportunity.
However, note that the market often reverses exactly at the 0.382, 0.50 or 0.618 levels as traders place a large number of orders around those levels.
- Get ahead, take the course now: Fibonacci Fast Track
Tip 3: Follow Market Sentiment Indicators
Finally, market sentiment indicators can also be used to buy low and sell high in the market. A change in market sentiment often causes active trends to reverse in similar recurring patterns.
When the economy is in a recession, fear dominates the market and everybody starts to sell. This is usually the best time to buy in the market.
Similarly, when the economy is doing well, markets reach new record-highs and optimism drives prices well above their fair value, providing investors with a great selling opportunity.
Traders can follow consumer and sentiment indicators, such as Consumer Confidence Surveys, Manufacturing and Service PMIs, Futures positioning on the FX market and other reports to measure the current market sentiment.
- Take our free course: Technical Analysis Explained
- Take our free course: Trends, Support & Resistance
- Take our free course: Japanese Candlesticks Decoded
- Take our free course: Reversal Price Patterns
- Take our free course: Continuation Price Patterns
- Take our premium course: Trading for Beginners
Risk Management
Such as with other trading strategies, “buy low, sell high” is not bullet-proof. Traders need to control their risks and manage their trades to get the most out of the market.
Always use stop-losses and never risk more than a small percentage of your trading account on any single trade. This allows you to limit your losses and stay in the market for longer during turbulent times when seemingly all trades are going against you.
Place your stop-losses at important technical levels, such as below the bottom of a higher low when buying during uptrends, and above the top of lower highs when selling during downtrends.
Your position size should be based on your stop-loss, i.e. the wider your stop-loss, the lower your position size needs to be to stay inside your risk-per-trade boundaries.
Final Words
Buying low and selling high is a trend-following trading approach that aims to catch higher lows during uptrends and lower highs during downtrends. While the principles behind the strategy are quite simple, traders find it extremely hard to identify the perfect point to buy or sell in the market.
In the first step, try to identify the trend direction with 200-period or 100-period moving averages or by looking for higher highs and higher lows for uptrends, and lower lows and lower highs for downtrends. The slope of the MA represents the current market trend – if the MA points up, the market is in an uptrend, and vice-versa.
By adding the 50-period MA to this formula, you could identify market corrections that go against the underlying trend that provide possible trading opportunities.
To get the exact price level at which to open a position, traders can use the Fibonacci retracement levels. The 61.8% and 38.2% are popular levels at which market corrections tend to end and reverse in the direction of the underlying market trend.
Finally, market sentiment indicators offer a longer-term view for trading the strategy that is more suitable for longer-term investors. When market sentiment and consumer confidence indicators decline, fear hits the market and prices fall well below their fair value, traders should look to buy.
As with all trading strategies, always use stop-loss levels to limit your losses in times of high market volatility and turbulence.