How to Enter Price-Action Trades

If you’re new to price action trading, I first recommend you read what price action trading is all about.
Once you’ve got to grips with this, let’s begin …
Price action trading in one of the most rewarding trading strategies available not only to Forex traders but also to traders who trade other financial markets.
Price action traders base their trading decisions on the analysis of the bare price-chart. There are no technical indicators involved in this trading strategy, since price-action traders consider technical indicators to be lagging the actual price-action.
Price action trading takes advantage of the current market psychology and sentiment of market participants by identifying important chart patterns, trendlines, channels, and peaks and troughs in the price. Those tools are also used to set stop-loss and take-profit levels of price-action trades.
- Learn more, take our premium course: Trading for Beginners
Main Tools of Price-Action Traders
If you’ve never got your feet wet in price-action trading, let’s quickly cover the main tools that price-action traders use to find high-probability trade setups. While this list doesn’t intend to be all inclusive, you’ll get a clear understanding of the most popular tools used in this highly-popular trading strategy.
Trendlines and Horizontal Lines
Price-action traders love to use straight lines in the chart analysis. Falling and rising trendlines are mainly used to identify downtrends and uptrends, respectively, while horizontal lines are placed at major swing highs and lows to mark important resistance and support levels in the chart.
Chart Patterns
Another popular tool used by price-action traders are chart patterns. Chart patterns are specific patterns that form in a price-chart which represent the market psychology of market participants, the battle between buyers and sellers.
Chart patterns are a very important concept in technical analysis, where one of its main premises is that history repeats itself. Chart patterns have shown to work well in the past, and technical traders (such as price-action traders) believe that the same patterns will have a similar success rate in the future.
Some of the most popular chart patterns are the Head and Shoulders pattern (reversal pattern), bullish and bearish wedges, triangles, rectangles, as well as harmonic patterns which are mostly based on Fibonacci ratios.
- Learn more, take our free course: Reversal Price Patterns
Trend Analysis
The next major tool in a price-action trader’s toolbox is trend analysis. Trends play an extremely important role in trading. In fact, many well-known traders, such as Bill Dunn, have made a fortune by simple trend-following trades where traders enter in the direction of the underlying trend.
You might have heard about the saying The Trend is Your Friend – and among trend-following traders, nothing is closer to the truth than this saying. The fact that Markets like to trend is also a basic premise of technical analysis.
Fibonacci Tools
Since exchange rates tend to fall and rise even though the overall trend is up or down, price-action traders use Fibonacci tools to measure at which level the price might reverse in the direction of the underlying trend.
Buy low, sell high has a lot to do with this point – a trader wants to buy in an uptrend when the price-correction reaches a low, and sell when the price reaches a high. Similarly, traders want to sell in a downtrend when the price-correction tops (reaches a high) and buy (i.e. close their sell position) when the price bottoms (reaches a low). Don’t worry, we’ll soon explain all those tools with detailed examples.
- Learn more, take our free course: Fibonacci: Fast-Track
Pullbacks
Pullbacks are another important tool in price-action trading, especially among breakout traders. Basically, if you miss a breakout trade, you can wait for a pullback to the broken support/resistance zone before entering into the direction of the actual breakout.
Pullbacks form for many reasons, such as profit-taking activities of market participants who jumped into the market when the initial breakout occurred. Traders need to sell to close their long positions, and buy to close their short positions. This buying/selling pressure pushes the price up/down to the initial breakout price.
Candlestick Patterns
Last but not least, many price-action traders use candlestick patterns to confirm an identified trade setup. Remember that candlestick patterns should only be used to confirm a trade based on other technical tools – candlestick patterns shouldn’t be traded on their own.
- Take our free course: Technical Analysis Explained
- Take our free course: Trends, Support & Resistance
- Take our free course: Japanese Candlesticks Decoded
- Take our free course: Reversal Price Patterns
- Take our free course: Continuation Price Patterns
- Take our premium course: Trading for Beginners
How to Identify and Enter Price-Action Trades
Entering into price-action trades is mostly based on some kind of confirmation that triggers the setups. Those confirmations are mostly breakouts out of important technical levels which are additionally confirmed by candlestick patterns.
Here are a few examples of how to enter into price-action trades in order to get the highest success rate.
#1 Chart Pattern Breakout Trading
Since chart patterns are one of the most popular tools of price-action traders, let’s cover them first. The following chart shows a Head and Shoulders pattern in the GBP/USD pair:
The elements of the pattern are:
- the left shoulder (1)
- the head of the pattern (2)
- the right shoulder (3)
and the neckline of the pattern which:
- connects the lows of both shoulders (4)
Head and Shoulders patterns are important reversal patterns that form at the top of an uptrend, and a price-action trader would wait to enter into a short position until:
the price breaks below the neckline (4)
Once a breakout occurs, the profit target of the trade would be:
- the height of the pattern (5)
- projected from the breakout point (6)
Stop-losses are usually placed either above the neckline (aggressive approach) or above the right shoulder (conservative approach).
The following chart shows another example of the Head and Shoulders pattern in the AUD/NZD pair:
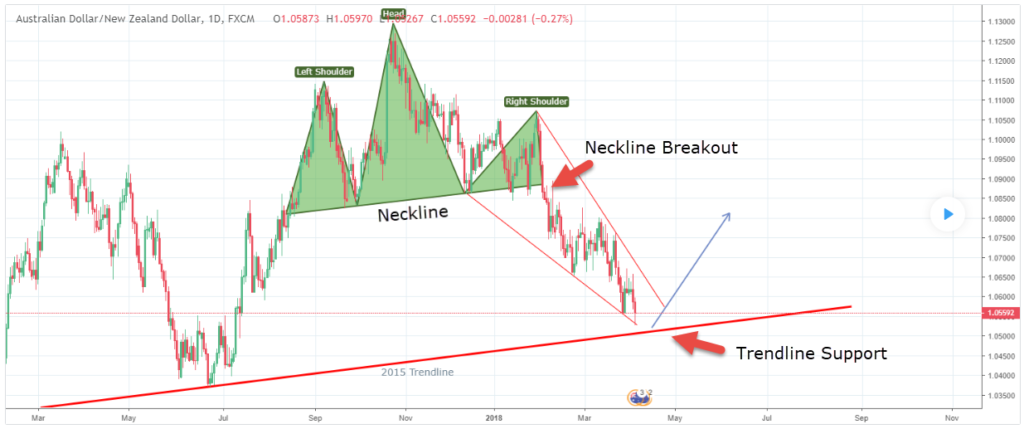
The pair’s daily chart created the left shoulder of the pattern, the head and the right shoulder, and a price-action trader would enter into a short position once the neckline of the pattern breaks.
Bear in mind that candlestick patterns are best used in situations like those – if an important bearish continuation pattern forms at the breakout level, such as a long bearish Marubozu, we have additional confirmation to enter into the short position. The profit target of the trade is again the height of the SHS pattern, projected from the breakout level.
Successful price-action traders combine various tools in their analysis. As you can see, the pattern’s profit target aligned with a rising trendline support, which immediately provided a potential buy opportunity if the price showed to respect that level.
How to know that a trendline is respected?
Use candlestick patterns again – a major reversal pattern, such as a Morning Star or Engulfing pattern, could be used to enter into a buy position right at the trendline support.
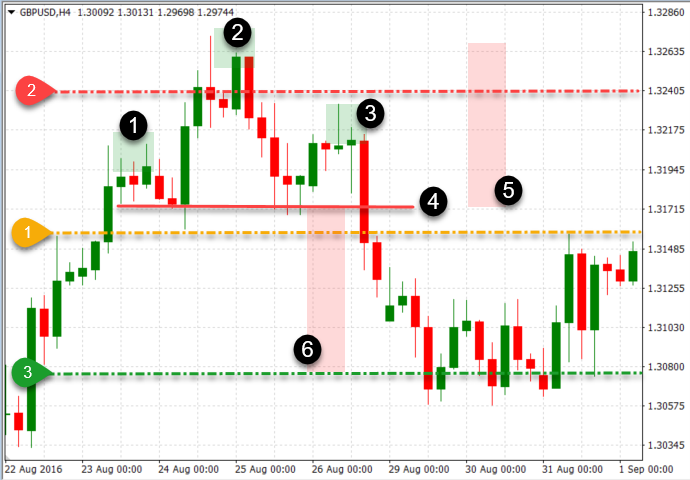
#2 Horizontal Breakout/Retest Trading
Some price-action traders prefer to enter into trades that are based on breakouts out of horizontal ranges. For this approach, you’ll need a ranging market with obvious upper and lower boundaries.
Take a look at the following chart:
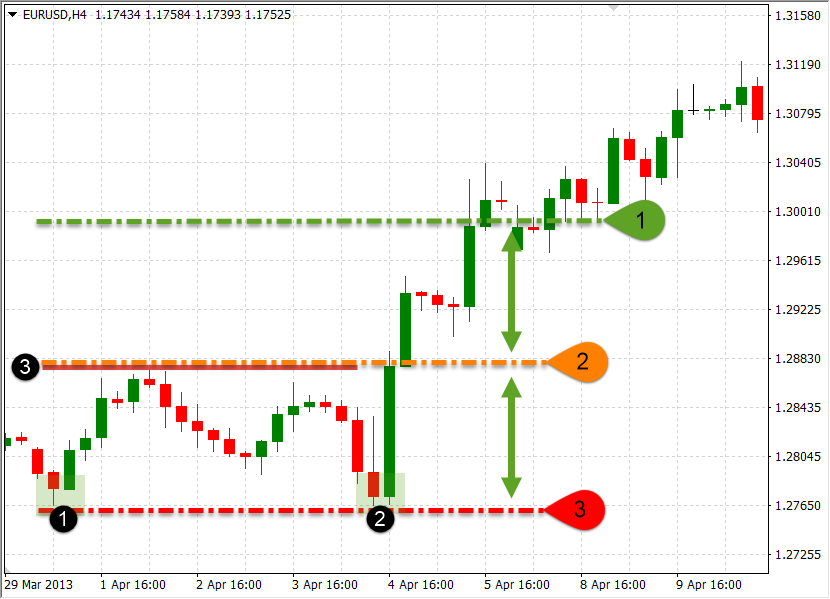
Notice the sideways trading market inside the upper resistance (2) and lower support line (1). Once a breakout occurs, you can place a profit-target which equals the height of the range projected to the breakout point, shown by line no. (1).
To enter into a horizontal breakout trade, the previous market environment needs to be in ranging mode, identified by the absence of higher highs and lower lows.
If you miss the breakout, don’t worry!
You can still enter on the pullback, i.e. on the retest of the broken support/resistance line.
Just like with breakouts out of chart patterns, profit-taking activities tend to reverse the price to the breakout point which offers a great opportunity to re-enter into the trade. Remember, broken support and resistance lines reverse their roles to become resistance and support lines in the future – a broken support becomes resistance, and a broken resistance becomes support.
The following chart shows a trade based on the retest of a horizontal support:
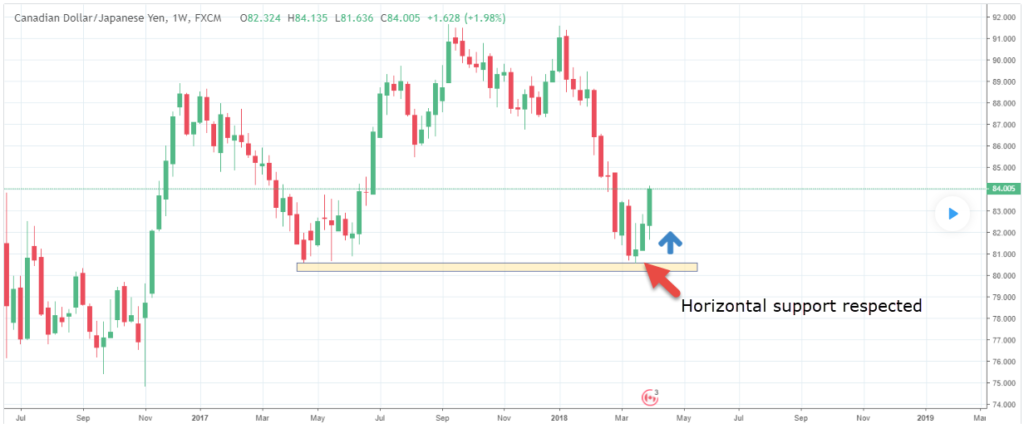
In this case, the horizontal support wasn’t broken and the price bounced off the area, creating a buy opportunity in the CAD/JPY pair.
Read:
- What are Key Chart Levels? (And How to Trade Them)
- Master all the Forex Charting Types
- A Superb Guide to Risk/Reward Ratios
#3 Trendline Breakout Trading
Besides horizontal breakouts, markets often tend to break through rising or falling trendlines during trending market environments. Price-action traders use trendlines to connect higher lows during uptrends and lower highs during downtrends, the break of which creates a trade opportunity in the direction of the breakout.
A broken rising trendline essentially means that the price is likely going to form a fresh lower low, which is a characteristic of a downtrend and signals a potential trend reversal. Similarly, a broken falling trendline means that the price is likely going to create a fresh higher high – a characteristic of an uptrend.
The following chart in the EUR/USD pair shows a breakout trade:
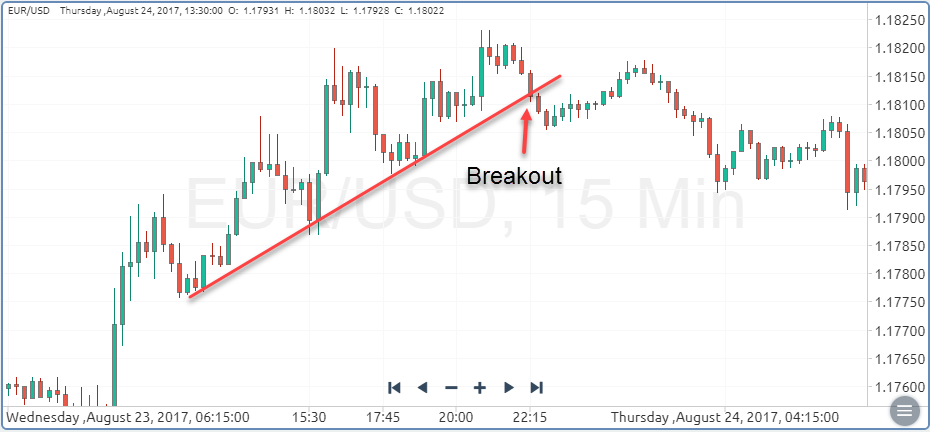
As you can see, the pair moved significantly lower as buyers didn’t manage to form a fresh higher high after the breakout.
#4 Pullback Trading
We’ve already mentioned the possibility to enter into a missed breakout trade once the price finishes a pullback to the broken support/resistance line.
The following chart in the USD/CAD pair shows exactly that:
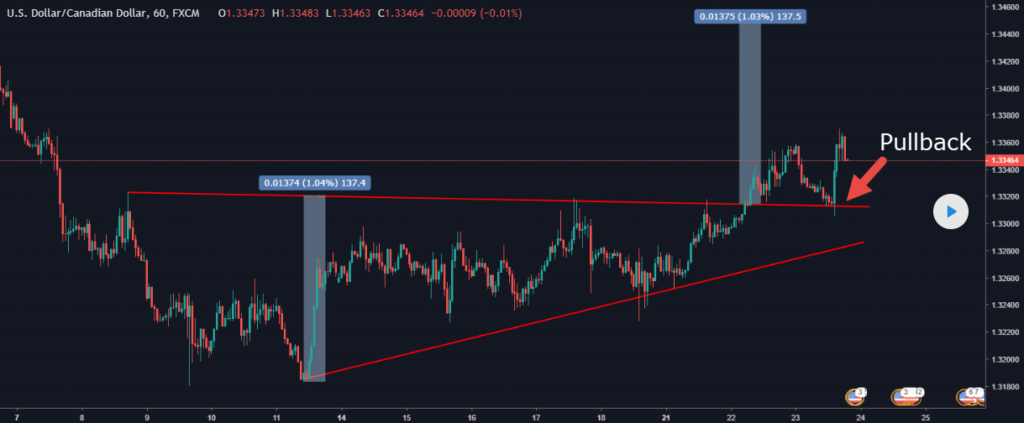
Notice the triangle chart pattern on the 1-hour chart, followed by a breakout to the upside. As you already know, the height of the triangle pattern is used to identify the profit-target for the trade, shown by the blue rectangles on the chart.
If you’ve missed to enter into the trade, simply wait for a pullback to the broken upper triangle line to enter in the direction of the breakout.
Sometimes, those pullbacks won’t form and the price will simply continue in its breakout direction. In that case, don’t chase the market and stand by the sideline – there are plenty of trading opportunities in other currency pairs.
#5 Entering into a Trend-Following Trade
Finally, let’s cover how to enter into trend-following trades, which are considered as trade setups with very high success rates. The first step is to identify the underlying market direction – is the pair in an uptrend or downtrend?
Uptrends are formed by higher highs and higher lows in the price, while downtrends are formed by lower lows and lower highs. It’s important to understand that on its way up, the price will occasionally move in the opposite direction of the trend. Those counter-trend price-moves are called price corrections and form the characteristic zig-zag pattern during uptrends.
To enter into a trend-following trade, traders use Fibonacci retracements to measure the distance of the correction relative to the previous impulse wave.
Here’s an image to make this concept crystal clear:
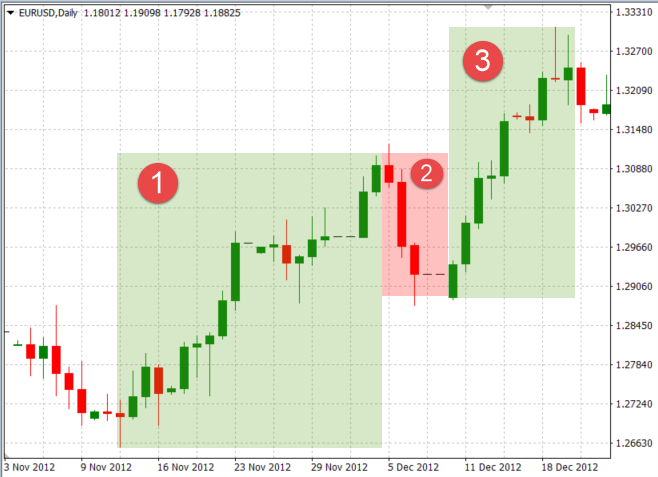
Notice the uptrend in the EUR/USD pair. The green rectangle (1) was the first impulse wave which created a higher high on the chart, followed by a price-correction marked by the red rectangle (2). The correction reached around 50% of the initial impulse wave after which the price reversed in the direction of the uptrend, creating a new impulse wave (3) and a fresh higher high.
To increase our success rate, we want to enter at the bottom of the price-correction.
How to enter a trend-following trade in real life is shown in the following chart:
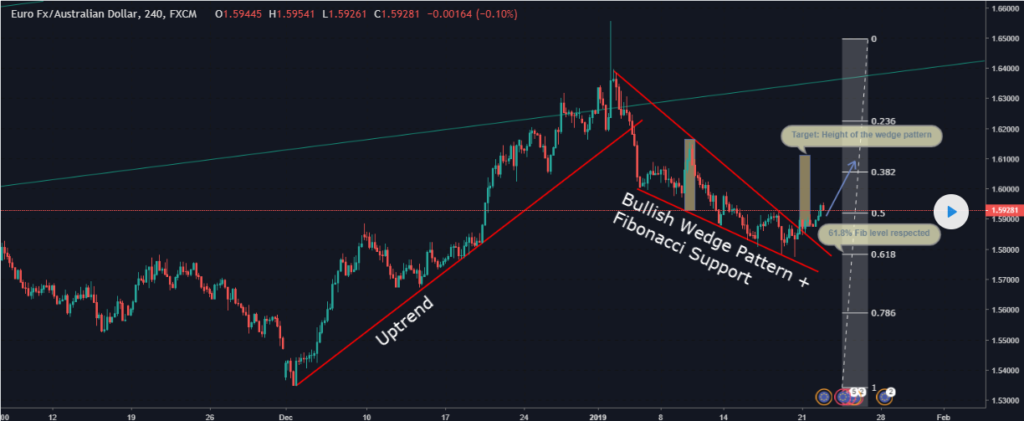
The market was in an uptrend, after which the price-correction created a bullish wedge pattern. Interestingly, the price broke out of the wedge pattern exactly at the 61.8% Fibonacci retracement, which means that the price reached 61.8% of the initial impulse wave’s height. Once the breakout is confirmed, a price-action trader could enter into a long position.
- Learn more, take our free course: Continuation Price Patterns
- Learn more, take our free course: Reversal Price Patterns
Price-action trading is an extremely popular trading approach
… which may take some time to master.
Open your chart and look for familiar chart patterns, identify important support and resistance levels, and try to spot whether the market is trending or not by looking for higher highs and lower lows in the chart.
Switch between different timeframes, as a downtrend on lower timeframes may actually be a price-correction of an uptrend on higher timeframes. Price-action trading requires experience, knowledge and patience, but it’s ultimately well worth the effort.
- Learn more, take our premium course: Trading for Beginners (Live Trades)