How to Trade Using a Forex Currency Strength Meter
Unlike stocks, currencies don’t fluctuate much on a daily basis. Most fluctuations of major pairs are in the ±1% range, and traders try to take advantage of those small price-changes by utilising leverage.
Just like stock traders, Forex traders aim to buy a currency cheap and sell it later at a higher price. When short-selling, traders borrow a currency at a higher price, sell it, wait for the price to fall and re-purchase the currency to return the loan.
In both cases, Forex traders make a profit on the difference between their entry and exit prices. But, how to know which currencies will fall or rise in the coming period? Traders use various strategies to get an answer to that question, and a Forex currency strength meter can also help in achieving that goal.
How to Read Currency Charts
Before we dig deeper into how to use a Forex currency strength indicator, let’s quickly cover the basics. There are eight major currencies in the Forex market:
- US dollar
- Canadian dollar
- British pound
- Euro, Swiss franc
- Japanese yen
- Australian dollar
- New Zealand dollar
All those currencies are traded in pairs, with the current exchange rate reflecting the price of the base currency (first currency) in terms of the counter currency (second currency.)
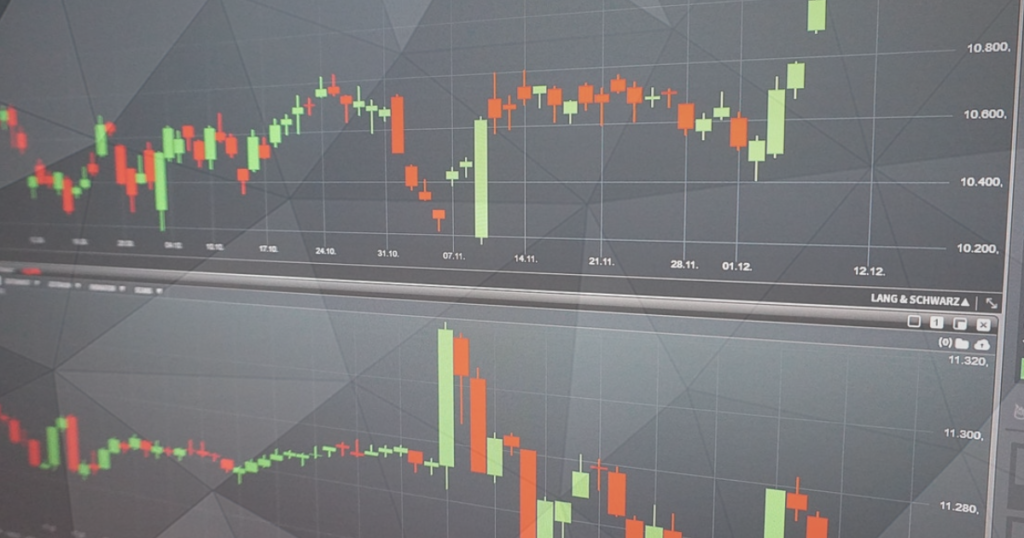
A Forex chart shows the changes in exchange rates relative to the time in a graphical way. Most traders use candlestick charts, which were popularised by Steve Nison back in the 90s. Candlestick charts are so-called OHLC charts, which means that they show the open, high, low, and close prices in a single candlestick.
Here is an example of what a candlestick looks like:
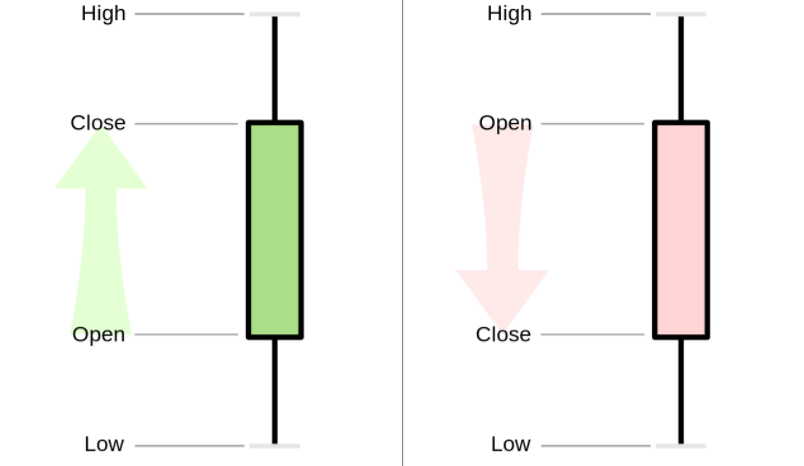
The highest and lowest prices reached during a trading period are shown by upper and lower wicks, while opening and closing prices build the candlestick’s body. In this article, we’re using a red body when the closing price is lower than the opening price, and a green body when the closing price is higher than the opening price.
A clean Forex candlestick chart is shown in the following graphic. This is the daily chart, which means that each candlestick covers one trading day and includes the open, high, low, and close prices of that day.
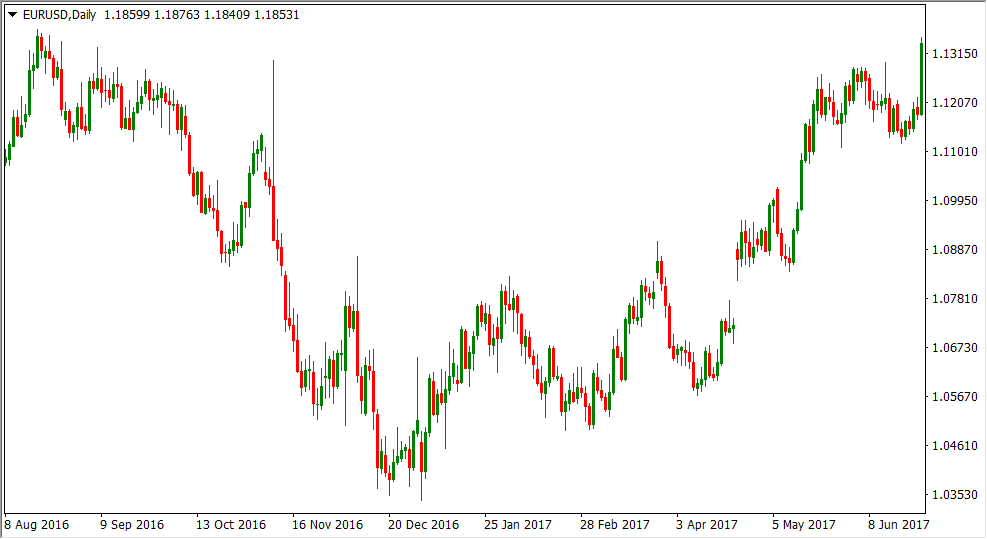
Read: History of the Forex Market
What are Weak Currencies?
So far, you’ve learned that a bearish candlestick suggests that the closing price is below the opening price for the selected timeframe. However, this doesn’t necessarily mean that the base currency got weaker against the counter currency.
So, what is a weak currency if a bearish candlestick doesn’t answer the question? Simply said, a weak currency is a currency that falls in value against all or most currencies.
If the EUR/USD exchange rate falls, the EUR/GBP rate falls, the EUR/AUD rate falls and the EUR/CAD rate falls, there is a high probability that the euro is a weak currency in the given timeframe.
- Start your trading journey, take our premium course: Trading for Beginners
What are Strong Currencies?
Similar to our explanation of weak currencies, a bullish candlestick in a currency pair’s chart doesn’t necessarily mean that the base currency is strong. In fact, a bullish candlestick can also signal that both currencies are weak, with the counter-currency being weaker for some reason. The net effect would be a rise in the chart, i.e. a bullish candlestick.
A currency that rises against most or all other currencies can be considered strong.
If EUR/USD falls, USD/JPY rises, AUD/USD falls, GBP/USD falls and USD/CAD rises, there is a high probability that the US dollar is a top-performer in the given timeframe, such as in times when the Fed unexpectedly decides to hike rates.
Read:
Strong Currency vs Weak Currency
Why is it important to know which currencies are strong and weak? Currencies like to trend, just like other financial instruments.
A strong currency today might continue to rise tomorrow, and a weak currency today might continue to fall tomorrow. If we could match a strong currency with a weak currency, we could build a complete trading strategy around this approach.
Imagine that, for some reason, the British pound is rising against all other major currencies. At the same time, the Australian dollar is falling against all other currencies. A Forex trader could buy the GBP/AUD pair and take advantage of a rising pound and a falling Aussie.
A currency doesn’t have to rise or fall against all other currencies to be considered strong or weak. If a currency rises against five or six of the remaining seven major currencies, it can still be considered a strong currency.
Similarly, if a currency falls against five or six other major currencies, it can still be considered a weak currency. You can still match these currencies in a trade with a relatively high success rate.
Read: 15 Must Know Terms: Forex Trading Terminology
What is the Weakest and Strongest Currency?
When using a Forex currency strength index, currencies are evaluated by both their closing price and the highest price reached during the session.
If a pair is above its prior bar’s high, this is considered very bullish. If a pair is above its prior bar’s close but below the high, this is considered slightly less bullish.
We can also determine two levels of bearishness in a currency pair. If a pair is below the prior bar’s low, this is considered very bearish. A pair can also be below prior bar’s close but above the low, which is slightly less bearish than the first example.
The strongest currency trades above prior bar’s high against all currencies if it’s a base currency, and below prior bar’s low in case that the currency is a counter-currency (second currency in a currency pair.)
The weakest currency trades below the prior bar’s low against all currencies if it’s a base currency, and above prior bar’s high if it’s a counter-currency.
What Impacts the Performance of a Currency?
Now that you know how to identify weak and strong currencies, let’s talk about the reasons why some currencies tend to be top-performers and some underperform.
The main reasons are fundamental. Important market reports that miss market expectations either to the upside or downside can impact the market sentiment and put increased buying or selling pressure on the currency.
The other reasons include technical levels. If a currency reaches an important support / resistance level in many currency pairs, market participants may start to open new positions and create buying / selling pressure in the currency.
However, most of the time the reasons for strong up- and down-moves are fundamental.
Currency Strength List / Heatmap
A currency strength list or heatmap shows the performance of currencies in a graphical way.
Currency strength lists include the strongest currencies in the top of the list and, as the list goes down, currencies become gradually weaker. The last currency in a currency strength list is the weakest currency for the selected time period.
While lists can be handy at times, currency heatmaps offer a more user-friendly experience. Heatmaps use colours to emphasise which currencies are strong or weak against other major currencies.
Here’s a heatmap from Investing.com:
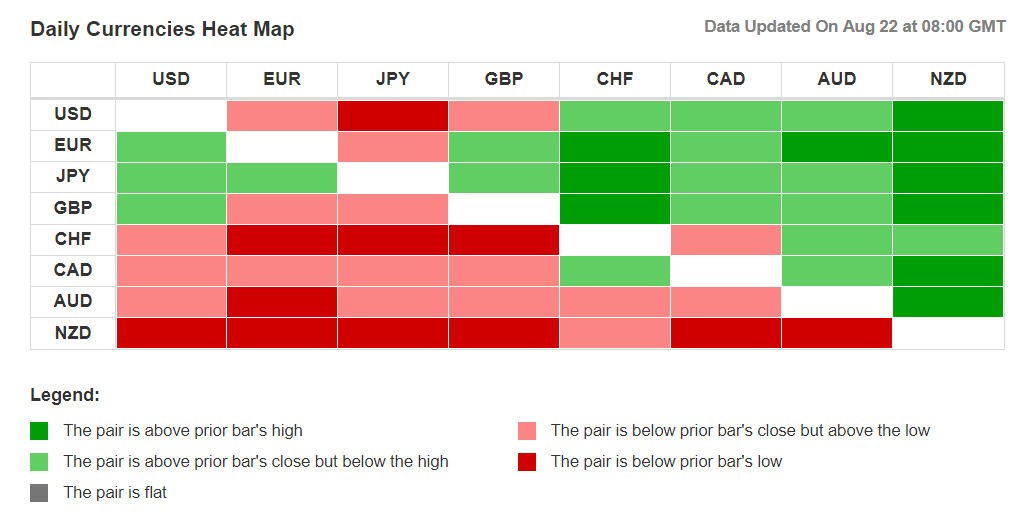
Take a look at the legend at the bottom of the image.
A dark green field signals that the pair is above prior bar’s high, a light green field that the pair is above prior bar’s close but below the high, a dark red field that the pair is below prior bar’s low and a light green field that the pair is below prior bar’s close but above the low.
When reading a heatmap, pay attention to the currencies in the first column, from the top to the bottom. Let’s start with the first one, the US dollar. The greenback is below prior bar’s close but above the low against the euro, and below prior bar’s low against the Japanese yen.
In other words, the US dollar is falling against both the euro and the Japanese yen, with the fall against the latter being quite strong. The US dollar is rising against the Swiss franc, the Canadian dollar, the Australian dollar, and the New Zealand dollar, with the rise against the NZD being above prior bar’s high.
Simply said, if all columns are dark red, the currency is extremely weak. If all columns are dark green, the currency is extremely strong. If there’s a mix of light red and dark red fields (such as the case with NZD), then the currency can be considered quite weak. If there’s a mix of light green and dark green fields (such as the case with the Japanese yen), then the currency can be considered quite strong. A mix of green and red fields signals normal market fluctuation.
The heatmap above shows that the Japanese yen is extremely strong, the euro is quite strong, the Australian dollar is quite weak and the New Zealand dollar is extremely weak.
A heatmap-based trading strategy would include buying the yen and the euro and matching them with weak currencies such as the Australian dollar and New Zealand dollar (shorting them.)
For example, you could sell AUD/JPY and NZD/JPY and buy EUR/AUD and EUR/NZD.
Bear in mind that this is the daily heatmap, which means that all data is related to daily candlesticks (open, high, low, close.)
Read: How to locate Markets on Your Brokers Platform
Risk Sentiment and Heatmaps
Heatmaps also offer an insight into the current risk sentiment of the market. If market participants become risk-averse, they’ll park their capital in safe-havens, such as gold, the Japanese yen, and Swiss franc. Risk currencies, such as the Australian dollar and the New Zealand dollar, are usually the first to take the hit – they’ll likely fall down.
Similarly, if safe-havens are falling and risk currencies are rising, this means that market participants have an increased appetite for risk for whatever reason. Maybe Trump tweeted he’s confident that the US and China will reach a trade deal?
Check out: Top 15 Twitter Trading Profiles You Must Follow
In any case, improved risk appetite may persist and a trader could enter into risk currencies and short safe-havens, for example.
Follow Your Timeframe
There are heatmaps for all major timeframes. At Investing.com, you’ll find heatmaps for the 30-minutes, 1-hour, 5-hours and daily timeframes, which is more than enough to determine weak and strong currencies and make a trading decision.
You’ll notice that currencies can be quite strong on some timeframes and relatively weak on other timeframes. The reason for this lies in the way how heatmaps use data to compute their fields.
For instance, a currency might be strong on the daily chart, but there could be a small pullback on shorter-term charts which are reflected by dark red and light red fields.
To avoid confusion, you should follow a single timeframe which aligns with your trading style. If you’re a short-term day trader, then look at the 30-minutes and 1-hour heatmaps. Longer-term traders may find the daily heatmaps more useful.
- Take our free course: Technical Analysis Explained
- Take our free course: Trends, Support & Resistance
- Take our free course: Japanese Candlesticks Decoded
- Take our free course: Reversal Price Patterns
- Take our free course: Continuation Price Patterns
- Take our premium course: Trading for Beginners
Best Free Currency Strength Meter
There are many free currency strength meters available for free on the internet, but I personally prefer Investing.com’s heatmap.
Investing.com’s heatmap offers all the features you need. It loads fast, has multiple timeframes and is very easy to read and understand. It also loads nicely on your smartphone, whether it’s an iOS or Android device.
Final Words
Although currency heatmaps are often neglected by both beginners and experienced traders, they offer valuable insight into the performance of currencies relative to each other.
Forex traders aim to buy a currency that goes up in value and sell a currency that goes down in value. While heatmaps are based on historical data (they’re lagging), market inertia may continue to push a rising currency up and a falling currency down.
Think about the underlying reasons why certain currencies are extremely strong or weak: Important news is gradually discounted by the price. Shifts in market sentiment take time to change, and as pieces of information become available to market participants, they’ll add to their positions and accelerate the initial price-moves. A currency heatmap can help you spot those changes.