
Welcome to our fast-track course on Bollinger bands, to get started please press play:
What are Bollinger Bands
Bollinger bands are one of the few indicators which help traders measure the volatility of a market’s price. Plotted around a simple moving average of the price, the bands widen when price volatility increases and narrow when the volatility decreases. This helps traders get a really clear, visual feel for volatility.
Calculating Bollinger Bands
The Bollinger bands indicator has three different bands:
The middle band is a simple moving average. The calculation for an SMA can be found in our Moving Averages Explained course.
Upper Band = n period SMA + (n period standard deviation of price x 2)
Lower Band = n period SMA – (n period standard deviation of price x2)
The standard deviation measures the variation in a data set, an example will help explain this, take these two datasets:
| Dataset#1 | Dataset#2 | |
| Day 1 | 10 | 10 |
| Day 2 | 11 | 5 |
| Day 3 | 12 | 15 |
| Day 4 | 11 | 8 |
| Day 5 | 12 | 12 |
| Standard deviation | 0.8 | 3.8 |
Both sets start and finish on the same numbers but their standard deviations are wildly different – dataset#2’s price moves around a lot and this is reflected in the higher standard deviation. For reference, you can see how the standard deviation is calculated in the worked example on the materials tab.
The trader sets the number of periods they want the indicator to look back over, 20 is typical. When using the indicator the trader would expect approximately 88% of all price activity to fall within the two bands (if set at 2 st. devs).
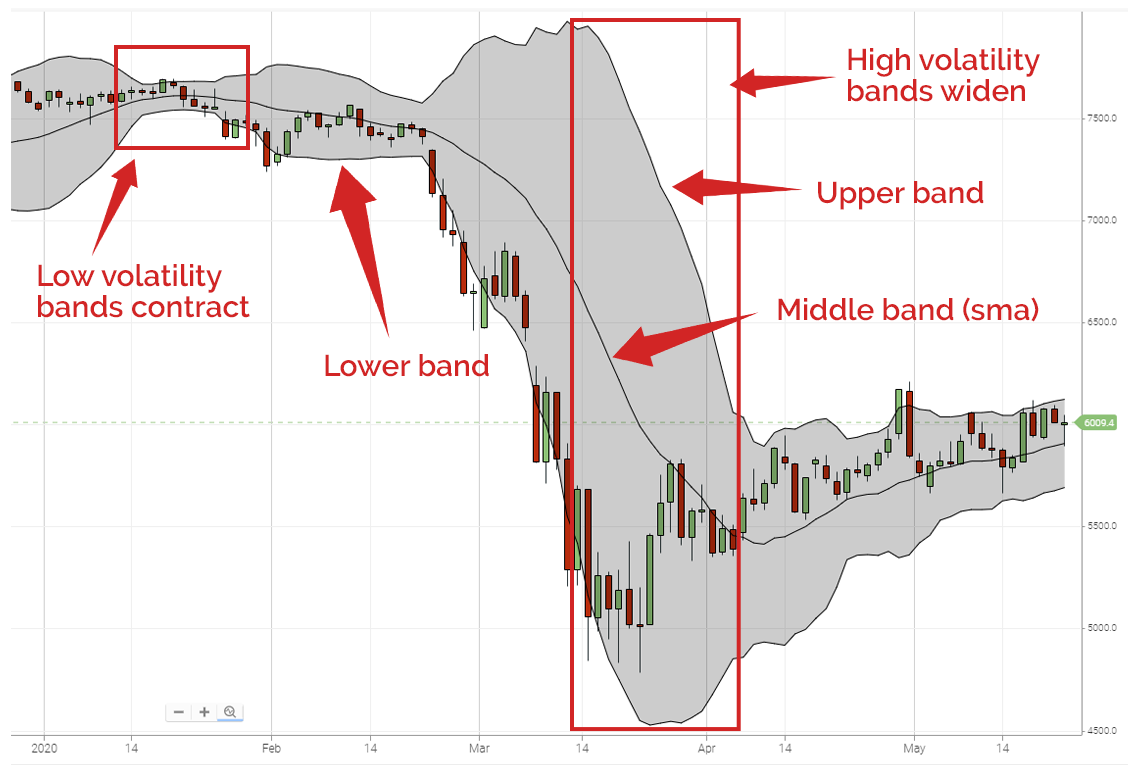
Bollinger bands on a chart
When we look at a chart it becomes much more visual. We can see the tree bands along with periods of high and low volatility, reflected by the contracting and widening of the bands.
- Bollinger bands are a lagging indicator showing price volatility.
- Bollinger bands consist of a middle band (SMA), an upper band and a lower band.
- The bands widen when volatility increases and contract when it reduces.
- Under normal conditions, 88% of price activity should be within bands set at 2 standard deviations.
If you’re happy with everything please click ‘complete’ to move on. You will be able to come back to the lesson.