
Welcome to our course on RSI, please press play to get started.
Relative Strength Index (RSI)
RSI is a very popular leading oscillating indicator, traders use RSI to identify potential changes in momentum. In addition, RSI can also help us confirm a trend.
RSI calculation
The RSI formula looks like this:
RSI = 100 – 100/1+RS RS = Average Gain/Average LossThe trader sets the number periods the indicator looks back over, its creator Welles Wilder recommends 14, so we also use that. Initially, the formula distinguishes between periods where the price goes up or down. Next, it averages out all the up days, the down days and divides them into one another to find the relative strength. The final bit of the calculation turns this into an index, so the output is between 0 and 100 – RSI is a bounded indicator.
The method of averaging changes a little in subsequent periods, if you’re interested in exploring this aspect further then its included in the worked example in the material tab.
RSI on a chart
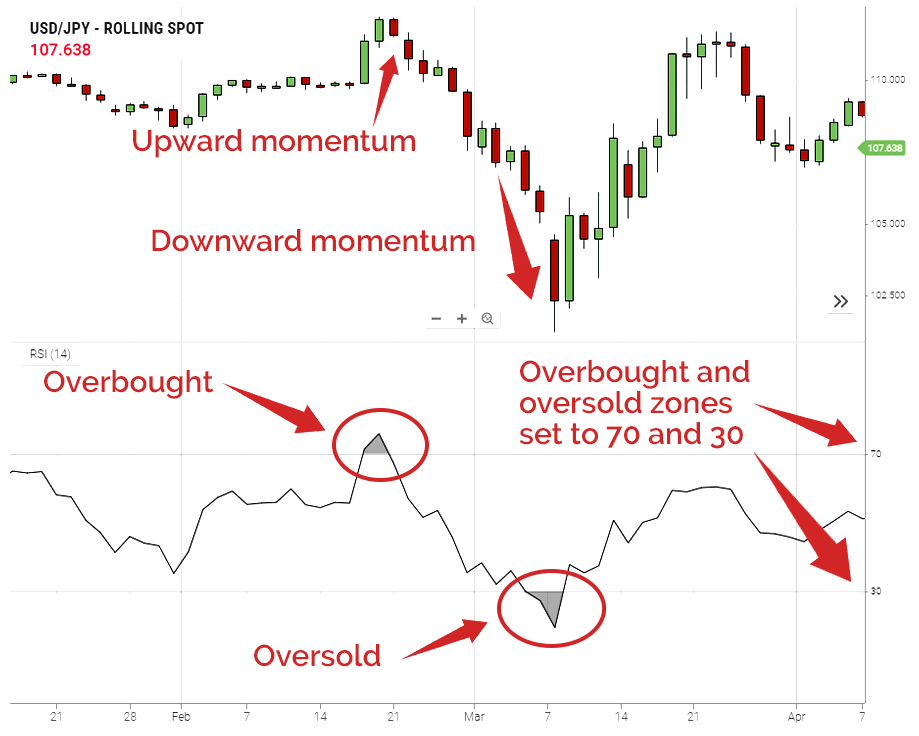
After applying RSI on a chart, and adding zones at 70 and 30 a trader can see overbought and oversold areas, if you look at the price in our USD/JPY chart this corresponds with clear momentum changes in price.
- RSI is a leading oscillating indicator used to measure momentum.
- RSI looks at all price changes in the period selected by the trader, it works out the average of the up moves and average of the down moves, then uses these to work the relative strength of the changes.
If you’re happy with everything please click ‘complete’ to move on. You will be able to come back to the lesson.