Easy to Understand Price Action Trading

If you’re new to the markets, chances are that you’re still looking for the holy grail of trading – you trade on short timeframes, clutter your chart with various technical indicators and look for the perfect trading strategy in trading forums.
What if I tell you that there is one trading technique that combines the best of all strategies?
Yes, it exists. It’s called price action trading. In this article, we’ll explain what price action is and how to use it to find high-probability trades in the Forex market.
What is Price Action Trading?
Price action trading relies on reading price charts and anticipating future price movements without any additional technical indicators. The only tool that price action traders need is the bare price-chart. However, this is not to say that price action traders don’t use other technical tools such as trendlines, Fibonacci tools, channels, support and resistance lines, price and candlestick charts.
As you can see, all mentioned tools used by price action traders are directly applied to the price-chart itself, since price action traders believe that price is the ultimate guide to forecast future price movements.
- Learn more, take our premium course: Trading for Beginners
Market Structure: Understanding Price Action Trading
One of the most important things that price action traders need to understand to make informed trading decisions is the current market structure.
Did you ever see the price going up or down without any reason?
A support or resistance level broke although you thought that the level was of high importance?
Most likely, you didn’t pay attention to the market structure when placing your trades. We’ll show you three simple steps to identify the current market structure and take a market direction with price-action trading techniques.
Step 1: Zones of Supply and Demand – Key Support and Resistance Levels
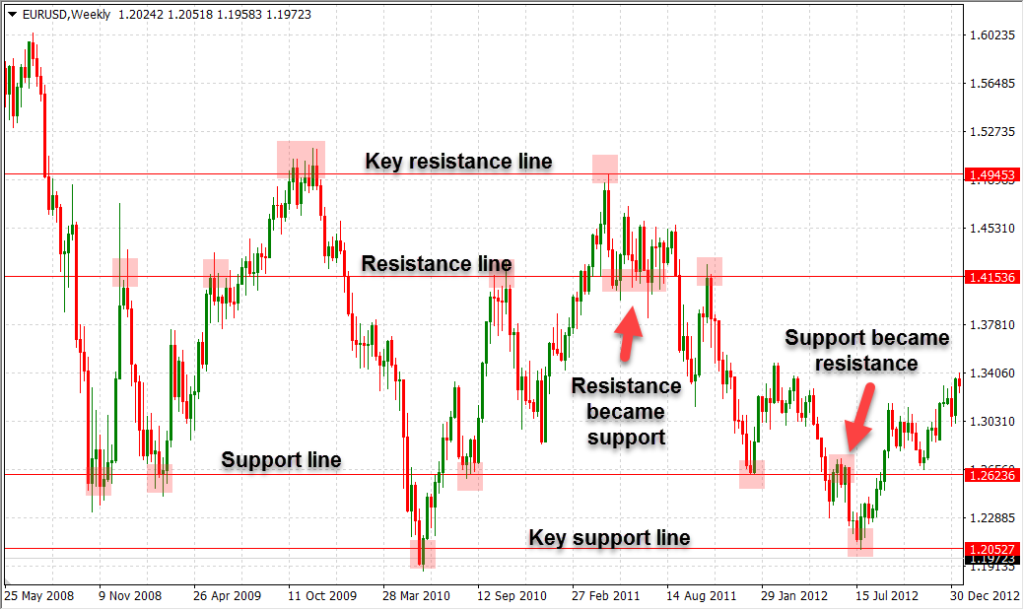
The first step in identifying the current market structure is to find and mark key technical levels on the price-chart. We refer to these key technical levels as to key support and resistance levels, which usually host a large number of buy and sell orders and can, therefore, be described as zones of increased supply or demand.
Identifying key support and resistance levels is best done on longer timeframes, such as the daily or weekly. Look for obvious swing highs and swing lows which have been respected multiple times in the past and mark them with horizontal lines. Those levels are key support and resistance levels at which the price will likely retrace.
Besides horizontal support and resistance levels, there are also other types of key technical levels that you need to be aware of. Some of the most important are listed below.
1) Psychological support and resistance levels – These levels usually form around round-number exchange rates, such as 1.00, 1.10, 1.20 etc. Many market participants place their buy and sell orders around round numbers, which is why the price can either respect those levels or break them with an unusually high trading momentum.
2) Fibonacci retracement levels – Fibonacci retracement levels are used to find potential levels at which the price might retrace and pick up its underlying trend. When applied on higher timeframes, important Fibonacci levels such as the 61.8% retracement level could become key technical levels which host a large number of pending orders.
3) Pivot Points – Pivot points can also be important technical levels at which the price can face support or resistance. Many traders follow daily pivot points and their support and resistance levels in their trading.4) Dynamic support and resistance levels – Key technical levels don’t have to be necessarily static – they can also be dynamic. Moving averages are usually used to identify dynamic key technical levels that arise around the 50-day EMA, 100-day EMA, 200-day EMA or around Fibonacci EMA levels such as the 144-day EMA.
5) Confluent zones of S/R – These are zones where important technical levels intersect, which emphasises the importance of those levels even more. For example, a rising trendline can provide support for a currency pair exactly at a price-level at which a horizontal support lies. This would form a confluence support zone of the rising trendline and the horizontal support.
- Learn more, take our free course: Fibonacci: Fast-Track
- Learn more, take our free course: Pivot Points: Fast Track
Read:
- All the Forex Chart Types Explained
- Top 5 Economic Indicators of the Forex Market
- Revealed: Technical vs. Fundamental Analysis
Step 2: Market Direction – Trends
Now that you have identified and marked key technical levels on the chart, it’s time to analyse the current market direction – the current trend. Many price-action traders take trades only in the direction of the overall trend, as these trade setups tend to have the highest probability of success.
Markets can move in three ways: up, down and sideways. Markets that move up are in uptrends, which are characterised by higher highs and higher lows on the chart. Higher lows are formed during price corrections, which are short-term price-movements in the opposite direction of the established trend. They usually form as a result of profit-taking activities of traders which are already in the uptrend.
Once the price drops, new buyers jump in the market as they consider the current market price to be relatively undervalued. This is how a higher low forms.
Markets that form lower lows and lower highs are referred to be in a downtrend. And finally, markets that don’t show the characteristic HHs and HLs of uptrends and LLs and LHs of downtrends, but are moving sideways without an obvious direction, are called ranging markets. During ranging markets, price-action traders tend to buy when the price reaches the lower range boundaries and to sell when the price reaches the upper range boundaries.
Once you identify the current market direction, you can apply a trend-following price-action technique by only placing trades in the direction of the overall trend.
Step 3: Market Psychology – Chart and Candlestick Patterns
So far, you’ve marked key technical levels on the chart and identified the overall market direction. Still, you’re still missing one key ingredient to get the bigger picture of the market and to understand the current market structure. This ingredient is the psychology of market participants, as shown by chart and candlestick patterns.
The market psychology will give you a valuable insight into what the majority of market participants think, so you can place your buy order exactly at the time when buyers gain the upper hand over sellers, and vice-versa.
To analyse the current market psychology, price-action traders usually use chart and candlestick patterns. Chart patterns are specific formations in the price that reveal a lot of information about the battle between buyers and sellers.
[adinserter block=”3″]Traders use chart patterns to anticipate future price movements depending on the outcome of the battle. Chart patterns have worked in the past, and traders and technical analysts believe that these patterns should also be working in the present and future.
In essence, chart patterns can be grouped into two major groups:
1) reversal patterns and 2) continuation patterns.
Below is a list of the major reversal and continuation patterns in the Forex market.
1) Reversal patterns: head and shoulders, inverse head and shoulders, rising wedges during uptrends, falling wedges during downtrends, double tops and bottoms, triple tops and bottoms, triangles
2) Continuation patterns: rectangles, rising wedges during downtrends, falling wedges during uptrends, pennants, flags, triangles
Whereas chart patterns can be formed by dozens or even hundreds of candlesticks, candlestick patterns are formed by a single candlestick or by up to a few candlesticks. Candlestick patterns are usually used to confirm a price action trade setup, and traders shouldn’t base their trading decision solely on candlestick patterns. These patterns give a valuable insight into the battle between buyers and sellers, which is represented by the upper and lower wicks of a candlestick and the size of its body.
- Learn more, take our free course: Reversal Price Patterns
- Learn more, take our free course: Continuation Price Patterns
Just like chart patterns, candlestick patterns can be grouped into reversal patterns and continuation patterns. Some of the most important patterns from both groups are listed below:
1) Reversal patterns: hammer, hanging man, three inside up, three inside down, star patterns (morning and evening), engulfing pattern
2) Continuation patterns: marubozu, three soldiers, three crows
Chart patterns and candlestick patterns provide a lot of information about the psychology of market participants.
Are they feeling bearish or bullish on a currency pair?
If the pair forms a reversal chart pattern, such as a head and shoulder which has a lower high as its right shoulder, chances are that sellers will have the upper hand in the near future.
On the other hand, a continuation chart patterns such as a rectangle shows that the market is in a phase of consolidation before a continuation in the direction of the previous trend most likely happens.
Read:
- These Forex Trading Strategies Will Make You Money
- Complete Beginners Guide to the Forex Market
- Essential Beginners Guide to the Spread Trading
Price Action Trading: Bringing it All Together
So far, we’ve learned three major elements of market structure which should give us a bigger picture of the markets in price-action trading.
We’ve marked zones of increased supply and demand, called key technical levels. Next, we’ve identified the overall trend of the market, which can be up, down or sideways.
And finally, we tried to measure the market sentiment and identify the psychology of market participants by chart patterns. Are market participants bullish or bearish on a specific currency pair?
Candlestick patterns are then used to confirm all these elements in a tradeable setup.
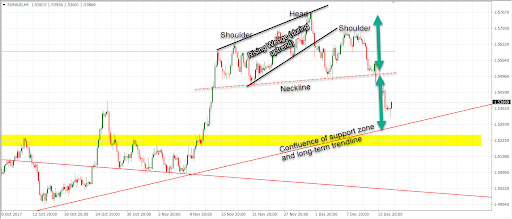
Here’s an example of all these tools put together. The EUR/AUD 4 hour chart shown below offered a nice trading opportunity with the break of the SHS (head and shoulder) neckline.
1) Key Technical Levels: We’ve identified a confluence zone of support based on a horizontal support level (yellow in the chart) and a long-term trendline (red in the chart). This confluence zone is likely to provide heavy buying power.
2) Market Direction: The overall trend in the pair was up, as identified by the higher highs and higher lows in the left-hand side of the chart. However, the formation of the SHS pattern (which is a major reversal pattern) suggests that a price correction or trend reversal might be ahead. The right shoulder of the pattern formed a lower high – a characteristic of a downtrend.
3) Market Psychology: Chart patterns in this price-chart revealed some interesting things about the psychology of market participants. The rising wedge during uptrends (a reversal pattern) suggested that buyers didn’t have enough power to push the price higher. After the rising wedge pattern broke, we could identify the right shoulder of an SHS pattern, which signals further weakness in the pair. Again, buyers didn’t manage to create a higher high and sellers are slowly regaining their power. Finally, the break of the neckline signalled a selling opportunity, with a profit target equal to the height of the pattern projected from the breakout point to the downside. A strong bearish candlestick (a marubozu pattern) confirmed our short setup and our profit-target was right at the confluence support zone.
Price Action FAQ
Where did Price Action Originate?
Price action trading is a discipline of technical analysis, which means that price action traders exist for as long as technical analysis has been used in the markets. Since price-action traders rely on price-charts and up-to-date market prices, this trading technique gained traction and became more popular with the advance of IT technology and computers in the 80s and 90s.
How Profitable is Price Action Trading?
The profitability of any trading technique depends on the experience and knowledge of the trader who utilises that technique. That being said, price-action trading is usually considered as one of the most profitable and rewarding trading techniques in the markets, as it regularly generates high-probability trades based on technical levels followed by the majority of market participants.
How to Master Price Action Trading?
Price action trading requires a lot of patience, discipline and experience, and traders who want to master this trading technique are best suited with a price action trading course that covers all aspects of it.
Final Words
In this article, we tried to provide an introduction to pure price action trading and market structure analysis that generate high-probability trades in the market.
Price action trading is based on technical analysis, but unlike other technical traders, price action traders don’t rely on technical indicators derived from past prices. Instead, price action traders are focused purely on the price itself – its swing highs, swing lows, trends, channels and trendlines.
While there are many interpretations of price action, some of which use a so-called price action trading equation which is based on daily standard pivot points, we aim for another technique by identifying the current market structure.
The current market structure is analysed in three steps:
- Marking key technical levels on the chart
- Identifying the current market direction (trend)
- Analysing the psychology of market participants through chart and candlestick patterns.